
Now we’re starting to get to the nuts and bolts of the culminating project that the students will be involved with for the remainder of the year. Today we explored how artists and musicians can take scientific data and adapt it to the arts. We looked at visual artists like Jill Pelto, who take an ice melt data graph and turned it into easy-to-understand art. We studied composers like Judy Twedt who wrote a piano solo that shows how Arctic Sea levels have changed between 1976-2006. We also looked at “Hebrides Redacted,” which is a piece of music that depicts the changes of whale population over time – with the musicians leaving out notes from Mendelssohn’s “Hebrides Overture” as the whale population decreases.
We had discussions on which is easier to understand – the art or the data. We noticed how some students preferred the graphs and data, while others felt that was difficult to understand and preferred the art and music.
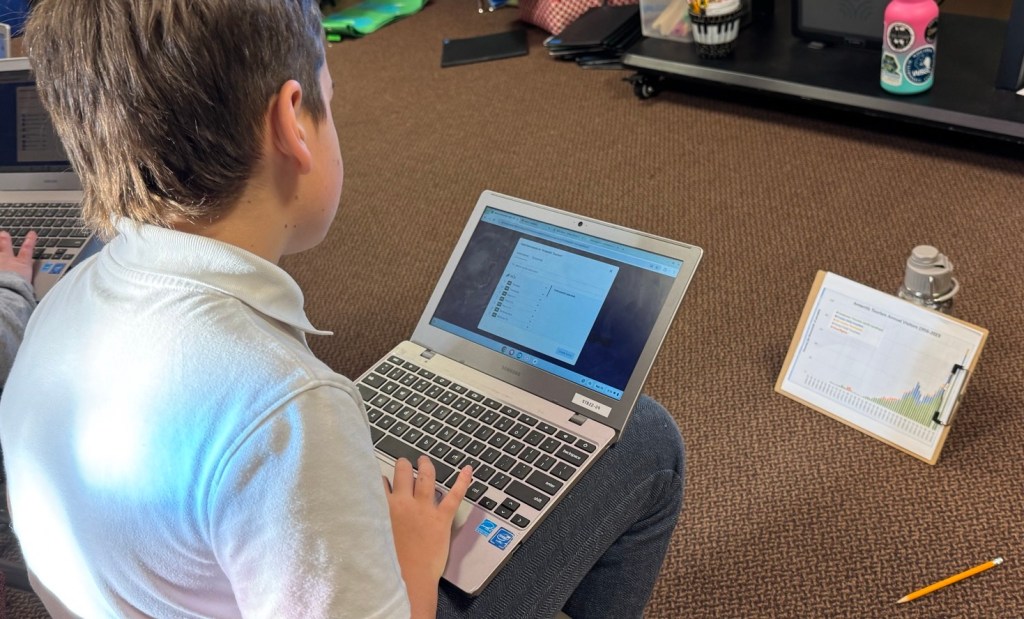
Next, students were tasked with creating their own music from data and graphs. The 7th and 8th graders have data they are analyzing from their science class project, so I had them take that data and compose music to represent what the graphs are trying to show. 5th and 6th graders were allowed to Google search something that they were interested in that would be displayed in graphs and charts. I had a collection of interesting graphs and charts for students in grades 3 and 4 to create their music with. Grades 1 and 2 had to find something they were interested in as a class, and then I guided them into making the music as students came up one at a time to select which notes should come next.
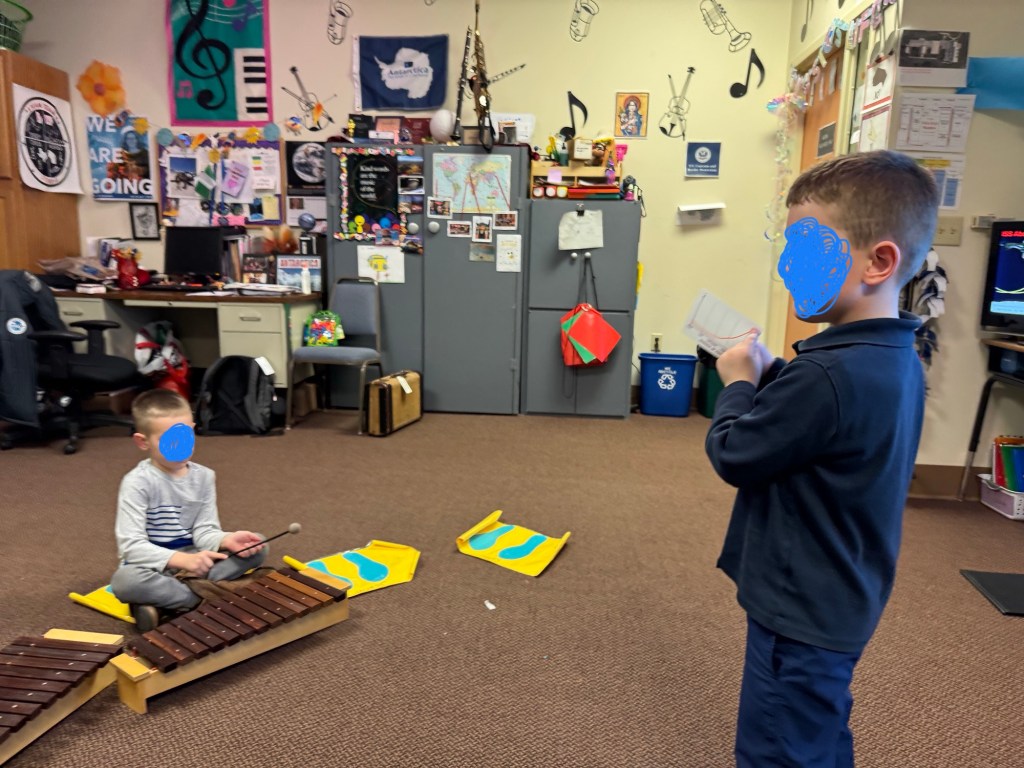
For the youngest kindergarten and preschool students, we used the science teacher’s game called “Charty Party.” I had one student come up in front of the class and be the “Scientist and Conductor,” and the rest of the class were musicians playing Orff instruments and Boomwhackers. The student playing the role of scientist and conductor had to look at the charts from the game, and then have musicians play their instruments in the shape of the graph. This was really fun to be able to show students how to read a graph, and to practice high and low sounds on our music instruments. Each student got a chance to be a Scientist/Conductor, and play each instrument!

Published by